Category:Network diagrams
Jump to navigation
Jump to search
- (en) Network diagram
English: A network diagram is any diagram representing a network and or a diagram with building blocks in the shape of a network.
diagram showing the order of activities | |||||
| Upload media | |||||
| Subclass of |
| ||||
|---|---|---|---|---|---|
| Has part(s) |
| ||||
| Said to be the same as | arrow diagram | ||||
| |||||
Subcategories
This category has the following 16 subcategories, out of 16 total.
A
C
E
- Elastic network models (1 F)
G
- Gephi Visualization (52 F)
N
O
- OLSR graphs (16 F)
P
- PERT charts (34 F)
S
- Semantic networks (24 F)
- Spin networks (18 F)
- SVG network diagrams (60 F)
T
Pages in category "Network diagrams"
This category contains only the following page.
Media in category "Network diagrams"
The following 200 files are in this category, out of 580 total.
(previous page) (next page)-
15th Century Florentine Marriges Data from Padgett and Ansell.pdf 1,400 × 1,454; 327 KB
-
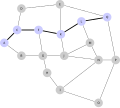
17 node mesh network.png 1,964 × 1,455; 284 KB
-
17 node mesh network.svg 512 × 457; 5 KB
-
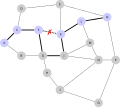
17 node network with a single link failure.png 1,965 × 1,455; 285 KB
-
17 node network with a single link failure.svg 512 × 457; 6 KB
-
1905 home network - multi devices graphic.jpg 806 × 457; 69 KB
-
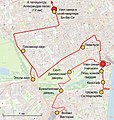
1937 coronation television network map RUS.jpg 1,813 × 1,909; 1.31 MB
-
2021-networking-report.pdf 1,275 × 1,650, 18 pages; 2.12 MB
-
3qos.png 745 × 449; 19 KB
-
6n-graf-2-clique.svg 350 × 240; 7 KB
-
A Multicast tree example before applying SBPT algorithm.jpg 530 × 349; 22 KB
-
A small network with both multiedges and self-edges.jpg 624 × 483; 24 KB
-
A small network with both multiedges and self-edges.svg 413 × 354; 21 KB
-
AcademicPapersRelationships.jpg 954 × 439; 34 KB
-
ActivityNetworkSmall.gif 100 × 100; 578 bytes
-
Ad hok.png 389 × 331; 13 KB
-
Address space in Variable Length Subnet Masking (VLSM).svg 258 × 277; 75 KB
-
Affiliation network nsdap munich 1930s.svg 698 × 630; 88 KB
-
Agoralib1.jpg 550 × 266; 10 KB
-
Agoralib2.jpg 1,094 × 759; 73 KB
-
Agoralib3.jpg 1,083 × 759; 61 KB
-
Agoralib4.jpg 1,041 × 693; 81 KB
-
Agoralib5.jpg 1,118 × 785; 64 KB
-
AIG-Interlocks-2004.jpg 900 × 524; 128 KB
-
Airports Network Map.png 6,230 × 3,444; 11.57 MB
-
AlgoForts.jpg 692 × 620; 38 KB
-
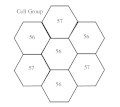
Amps cell group.gif 570 × 506; 8 KB
-
Amps cell group.svg 534 × 474; 11 KB
-
Anapro diagrama.jpg 750 × 345; 35 KB
-
Anycast improved.svg 1,052 × 744; 10 KB
-
Anycast2.svg 1,052 × 744; 9 KB
-
Aplicaca.jpg 1,218 × 705; 28 KB
-
ARINC 834 Design.svg 561 × 251; 31 KB
-
ASON Logical Structure.svg 1,052 × 744; 22 KB
-
ATM-Netzwerk.png 794 × 1,123; 74 KB
-
BackBone.JPG 677 × 602; 90 KB
-
Basic TCP-IP node-en.svg 460 × 481; 30 KB
-
Basic Toplology -ar.png 670 × 340; 22 KB
-
Basic Topology -en.png 670 × 340; 22 KB
-
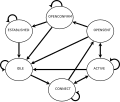
BGP FSM 3.svg 1,328 × 1,121; 27 KB
-
BGP FSM.svg 670 × 403; 21 KB
-
BGP MED.svg 1,255 × 555; 87 KB
-
BGP Message Header.svg 512 × 200; 3 KB
-
BGP Open message diagram.svg 512 × 240; 5 KB
-
BGP process.svg 1,328 × 554; 25 KB
-
Bgp-fsm.jpg 823 × 459; 76 KB
-
Bildungsbegleiter.jpg 1,170 × 422; 46 KB
-
Bipartite network projection.png 354 × 259; 43 KB
-
Bitcoin's Lightning Network Visualization.png 7,592 × 4,292; 16.02 MB
-
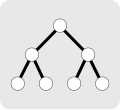
Boom-structuur.svg 416 × 379; 3 KB
-
Bp-6-node-network.jpg 384 × 214; 19 KB
-
Brainstorming Distance Bounding Protocol.png 1,071 × 293; 21 KB
-
BrutalKangaroo.png 728 × 380; 38 KB
-
Bsd sockets.svg 800 × 800; 7 KB
-
Bus-structuur.svg 416 × 379; 3 KB
-
Butterfly network.gif 837 × 1,029; 25 KB
-
Bvlarchivioports.jpg 598 × 288; 57 KB
-
Cabeceras 802.11 y 802.3.png 623 × 450; 21 KB
-
Categories error de resiliència.jpg 968 × 260; 22 KB
-
Categorías de ANT.jpg 418 × 336; 28 KB
-
CDC2011.jpg 159 × 224; 15 KB
-
CFR-Interlocks-2004.jpg 1,096 × 558; 181 KB
-
Chord network.png 500 × 500; 58 KB
-
Chord route.png 500 × 500; 58 KB
-
Client versus Host network diagram example - Remote desktop.gif 664 × 363; 23 KB
-
Client-Server 2-tier architceture - ar.png 560 × 330; 6 KB
-
Client-Server 2-tier architceture - en.png 560 × 330; 6 KB
-
Client-Server 2-tier architceture-ar.svg 345 × 99; 90 KB
-
Client-Server 2-tier architceture-en.svg 350 × 114; 13 KB
-
Client-Server 3-tier architecture - ar.png 720 × 360; 7 KB
-
Client-Server 3-tier architecture - en.png 720 × 360; 8 KB
-
Client-Server Model - ar.png 697 × 356; 19 KB
-
Client-Server Model - en.png 696 × 353; 20 KB
-
Client-server model example (Web browsing) - ar.png 900 × 500; 15 KB
-
Client-server model example (Web browsing) - en.png 900 × 500; 13 KB
-
Client-server model example (Web browsing) - PlantUML - en.svg 682 × 483; 12 KB
-
Client-Server Model-ar.svg 319 × 153; 171 KB
-
Client-Server Model-en.svg 319 × 153; 16 KB
-
Client-Server N-tier architecture - ar.png 900 × 320; 9 KB
-
Client-Server N-tier architecture - en.png 900 × 320; 8 KB
-
Client-server Vs peer-to-peer - en.png 500 × 400; 6 KB
-
Client-server Vs peer-to-peer -ar.png 500 × 400; 6 KB
-
Cloud Computing.png 603 × 396; 53 KB
-
Cluster plan.png 881 × 481; 21 KB
-
Communication channel classification - ar.png 750 × 230; 6 KB
-
Communication channel classification - en.png 750 × 230; 7 KB
-
Communication Channel Model - ar.png 600 × 180; 5 KB
-
Communication Channel Model - en.png 600 × 180; 5 KB
-
Comparison of point to point vs hub and spoke.svg 512 × 1,024; 398 bytes
-
Components.svg 511 × 277; 6 KB
-
Computernetwork.png 961 × 577; 166 KB
-
Controllability YYL 1.pdf 2,095 × 993; 449 KB
-
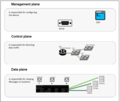
Conventional way of networking 3 planes of operation.png 608 × 516; 56 KB
-
Coordination of bits in network.jpg 2,048 × 1,536; 249 KB
-
Critical Path Method (activity network).svg 693 × 204; 25 KB
-
Cross-site scripting attack sequence diagram - ar.png 660 × 390; 7 KB
-
Cross-site scripting attack sequence diagram - en.png 660 × 390; 7 KB
-
CT844702.jpg 552 × 112; 12 KB
-
CYCLADES - ar.png 1,108 × 1,100; 474 KB
-
CYCLADES - en.png 1,108 × 1,100; 474 KB
-
CYCLADES Model - ar.png 500 × 525; 19 KB
-
CYCLADES Model - en.png 500 × 525; 19 KB
-
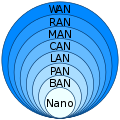
Data Networks classification by spatial scope.png 688 × 409; 62 KB
-
Data Networks classification by spatial scope.svg 512 × 512; 667 bytes
-
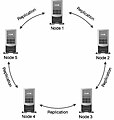
Data replication.jpg 390 × 409; 13 KB
-
DE-CIX Network Schema.svg 570 × 410; 32 KB
-
Defensa en profundidad y altura.jpg 1,552 × 1,142; 334 KB
-
DES key schedule.svg 328 × 626; 75 KB
-
DES-key-schedule.png 300 × 491; 33 KB
-
DES-main-network.png 640 × 1,725; 88 KB
-
DES-main-network.svg 238 × 672; 30 KB
-
Designated system.png 343 × 241; 3 KB
-
Desktop-as-a-Service in Cloud Computing architectures.png 603 × 396; 36 KB
-
DHCP client-server model example - with Broker - ar.png 660 × 460; 44 KB
-
DHCP client-server model example - with Broker - en.png 660 × 460; 46 KB
-
DHCP session-ar.png 424 × 600; 16 KB
-
DHCP Snooping -ar.png 722 × 348; 22 KB
-
DHCP Snooping -en.png 722 × 348; 21 KB
-
DHCP Snooping -zh.svg 722 × 348; 35 KB
-
DHCP Terminology - ar.png 822 × 450; 35 KB
-
DHCP Terminology - en.png 820 × 451; 36 KB
-
Diagram for distributed databases1.gif 851 × 968; 16 KB
-
Diagram of Lambda Architecture (Druid data store).png 561 × 242; 36 KB
-
Diagram of Lambda Architecture (generic).png 532 × 287; 40 KB
-
Diagram of Lambda Architecture (named components).png 532 × 287; 45 KB
-
Diagrama d'accés a internet (català).svg 1,548 × 1,540; 631 KB
-
Diagrama- Servei Musica Online.jpg 537 × 274; 50 KB
-
Digital Communications Network.png 507 × 337; 35 KB
-
Direct Vs P2P Download - ar.png 943 × 548; 41 KB
-
Direct Vs P2P Download - en.png 943 × 548; 42 KB
-
Directly conected route - ar.png 623 × 378; 26 KB
-
DisenoSolucionPortalCautivo.jpg 844 × 662; 40 KB
-
DMZ Servidor0.jpg 1,117 × 902; 117 KB
-
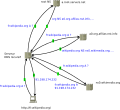
DNS iterations.svg 954 × 868; 89 KB
-
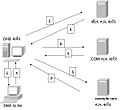
DNS Resolution.JPG 592 × 544; 42 KB
-
Drawing1 (pic).jpg 585 × 360; 21 KB
-
Drawing1-2.jpg 585 × 441; 21 KB
-
DualMesh network.png 506 × 402; 28 KB
-
Ego network.png 496 × 481; 43 KB
-
EIGRP RD and FD - ar.png 995 × 543; 72 KB
-
EIGRP RD and FD - en.png 980 × 543; 65 KB
-
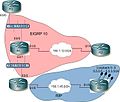
Eigrp-stub.jpg 744 × 632; 47 KB
-
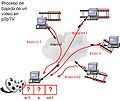
EjemploBajadaVideop2p.jpg 654 × 549; 45 KB
-
Election DR.jpg 550 × 341; 47 KB
-
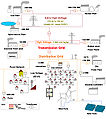
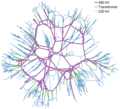
Electricity grid schema- lang-en.jpg 1,243 × 1,400; 231 KB
-
Electricity grid simple- North America ca.svg 1,401 × 519; 43 KB
-
Electricity grid simple- North America es.svg 1,401 × 519; 65 KB
-
Electricity grid simple- North America.svg 1,401 × 519; 37 KB
-
Encapsulation - ar.png 1,009 × 220; 22 KB
-
Encapsulation - en.png 1,009 × 220; 6 KB
-
End-to-end Concept-ar.svg 1,280 × 300; 254 KB
-
End-to-end Concept-en.svg 1,280 × 300; 96 KB
-
End-to-end relationship - ar.png 675 × 301; 36 KB
-
End-to-end relationship - en.png 675 × 300; 34 KB
-
Enron Email Network.jpg 1,024 × 1,024; 242 KB
-
EPN Frame-Relay and Dial-up Network.svg 1,488 × 1,052; 88 KB
-
EPN Leased Line and dial-up Network.svg 1,488 × 1,052; 87 KB
-
Epygi diagram.jpg 228 × 189; 15 KB
-
Error de Resiliència.jpg 381 × 421; 22 KB
-
Error llaços.jpg 922 × 261; 22 KB
-
Error llaços.svg 922 × 261; 8 KB
-
Estructured cabling subsystems.svg 404 × 330; 44 KB
-
EthercatOperatingPrinciple.svg 1,520 × 1,080; 44 KB
-
Example English Phonological System in Relational Network Notation.png 1,084 × 696; 92 KB
-
Example of a Clause in a Relational Network Analysis.png 1,700 × 1,700; 255 KB
-
Extended-star-topology.png 97 × 99; 1,009 bytes
-
Fcoe img.jpg 731 × 713; 44 KB
-
Firewall0.jpg 993 × 494; 38 KB
-
Flat vs hierarchy topology - ar.png 825 × 425; 32 KB
-
Flat vs hierarchy topology - en.png 825 × 425; 33 KB
-
Flower topology.JPG 520 × 383; 25 KB
-
FNC-WAN-1999-PreExpansion-CSA-Kraig-Beahn-BCE-Jim-Hillger.png 2,617 × 3,300; 647 KB
-
Forbidden triad.png 860 × 315; 23 KB
-
Force4 Dataflow.png 402 × 507; 93 KB
-
Forward proxy h2g2bob.svg 400 × 150; 16 KB
-
Forward Proxy.png 539 × 198; 13 KB
-
Fragmentation for APL - ar.png 2,780 × 594; 38 KB
-
Fragmentation for APL - en.png 2,780 × 594; 28 KB
-
Frame Relay Fragmentation Types - ar.png 1,024 × 526; 56 KB
-
Frame Relay FragmentationTypes - en.png 1,018 × 512; 58 KB
-
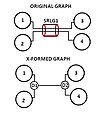
G XFORM FAIL.JPG 376 × 406; 18 KB
-
G XFORM NODORDER.JPG 619 × 417; 23 KB
-
G XFORM ORIG.JPG 619 × 417; 20 KB
-
G XFORM XFORMED.JPG 598 × 390; 17 KB
-
Gene regulatory networks.jpg 2,000 × 1,134; 640 KB
-
Generic 5G network slicing framework.svg 793 × 570; 31 KB
-
Gephi 0.9.1 Network Analysis and Visualization Software.png 1,397 × 871; 566 KB
-
Gffs.jpg 480 × 360; 26 KB
-
Graphical network.png 800 × 800; 432 KB
-
Grid-artere.svg 190 × 135; 4 KB
-
Grid-spiderweb.svg 270 × 200; 9 KB
-
Grid-tree.svg 210 × 194; 9 KB
-
Grüne Koordination.png 1,504 × 1,869; 174 KB
-
HCN-network.png 307 × 242; 6 KB







.svg.png)





.png)
.png)










_-_ar.png)
_-_en.png)
_-_plantuml_-_en.svg.png)







.png)
.png)
.png)
.svg.png)


.jpg)


